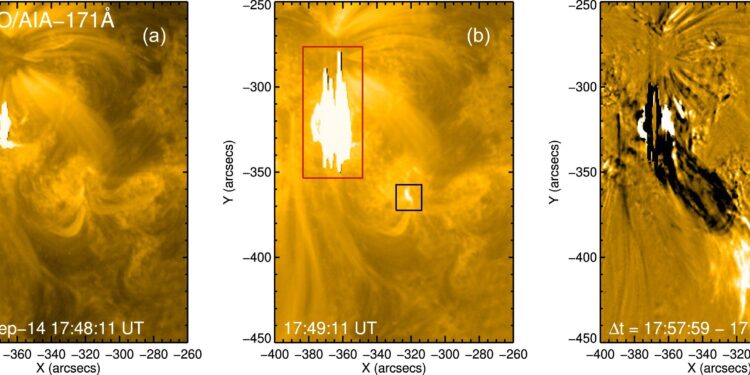
Temporal evolution of the fan-shaped flare observed at 171 Å by the SDO/AIA on 24 September 2014. (a) The initial phase of the fan-shaped flare (Fig. 1) recorded at 17:48:11 ut. (b) The main flare (red, larger frame) and the distant brightening source (blue, smaller frame). (c) Sliding difference image to highlight the presence of eruptive plasma. Credit: Monthly Notices of the Royal Astronomical Society (2024). DOI: 10.1093/mnras/stae1511
Solar flares are extremely intense events that occur in the Sun’s atmosphere and last from a few minutes to several hours. According to the standard model of flares, the energy that triggers these explosions is carried by accelerated electrons that rush from the magnetic reconnection region of the corona to the chromosphere.
When electrons collide with the chromospheric plasma, they deposit their energy in the plasma, which is then heated and ionized. They also cause intense radiation in several bands of the electromagnetic spectrum. The regions in which the energy is deposited are called “starting points” of solar flares, which normally appear in magnetically connected pairs.
A recent study sought to test the validity of the Standard Model by comparing the results of computer simulations based on the model with observational data provided by the McMath-Pierce telescope during the solar flare SOL2014-09-24T17:50. The study focused on measuring time shifts between infrared emissions from two paired chromospheric sources during the flare and is published in the journal Monthly Notices of the Royal Astronomical Society.
“We found a significant difference between the telescope observation data and the behavior predicted by the model. In the observation data, the paired anchor points appeared as two very bright regions of the chromosphere,” said Paulo José de Aguiar Simões, first author of the paper and affiliate professor at the Center for Radio Astronomy and Astrophysics (CRAAM) of the School of Engineering at Mackenzie Presbyterian University (EE-UPM) in São Paulo, Brazil.
“Since the incident electrons exited the same region of the corona and followed similar trajectories, the two spots should have brightened almost simultaneously in the chromosphere according to the model, but the observational data showed a delay of 0.75 seconds between them.”
A lag of 0.75 seconds may seem insignificant, but the researchers calculated that the maximum lag according to the model should be 0.42 seconds considering all possible geometric configurations. The actual figure was almost 80% higher.
“We used a sophisticated statistical technique to infer the time shifts between pairs of anchor points and estimated the uncertainties of these values by the Monte Carlo method. In addition, the results were tested by electron transport simulations and radiative-hydrodynamic simulations,” Simões said.
“By deploying all these resources, we were able to construct different scenarios regarding the flight time of electrons between the corona and the chromosphere and the production time of infrared radiation. All scenarios based on the simulations showed much smaller time shifts than the observational data.”
One of the scenarios tested involved spiral and magnetic trapping of electrons in the corona.
“Using electron transport simulations, we explored scenarios involving magnetic asymmetry between the base points of the flares. We expected that the time lag of electron chromosphere penetration would be proportional to the difference in magnetic field strength between the base points, which would also increase the difference in the number of electrons reaching the chromosphere due to the magnetic trapping effect.
“However, our analysis of the X-ray observational data showed that the base point intensities were very similar, indicating similar amounts of electrons deposited in these regions and ruling this out as the cause of the observed emission time shifts,” he said.
Radiative-hydrodynamic simulations also showed that the time scales of ionization and recombination in the chromosphere were too short to explain the shifts.
“We simulated the time scale of the infrared emission. We calculated the transport of electrons to the chromosphere, the energy deposition of electrons and its effects on the plasma: heating, expansion, ionization and recombination of hydrogen and helium atoms, and radiation produced at the site, which has the effect of releasing excess energy,” Simões said.
“The infrared radiation is produced by the increase in electron density in the chromosphere due to the ionization of hydrogen, which is originally in a neutral state in the plasma. Simulations showed that ionization and infrared emissions occur almost instantaneously due to the penetration of accelerated electrons, and therefore cannot explain the 0.75 s time lag between emissions at the starting point.”
In summary, none of the processes simulated by the model proved capable of explaining the observational data. The conclusion reached by the researchers was somewhat obvious: the standard model of solar flares must be reformulated, as required by the scientific method.
“The observed time lag between chromospheric sources challenges the standard model of electron beam energy transport. This longer delay suggests that other energy transport mechanisms may be involved. Mechanisms such as magnetosonic waves or conduction transport, among others, might be necessary to explain the observed lag. These additional mechanisms should be considered to achieve a complete understanding of solar flares,” Simões said.
More information:
Paulo JA Simões et al., Precise timing of solar flare point sources from mid-infrared observations, Monthly Notices of the Royal Astronomical Society (2024). DOI: 10.1093/mnras/stae1511
Quote: Study raises questions about validity of standard model of solar flares (2024, September 23) retrieved September 23, 2024 from
This document is subject to copyright. Apart from any fair dealing for the purpose of private study or research, no part may be reproduced without written permission. The content is provided for informational purposes only.


