

Generation of a mouse brain atlas of early postnatal development (epDevAtlas). Credit: Natural communications (2025). DOI: 10.1038/s41467-025-64549-x
Brain growth and maturation does not progress in a linear, stepwise manner. Rather, it is a dynamic, choreographed sequence that changes in response to genetics and external stimuli like sight and sound. This is the first high-resolution growth curve explaining changes in key brain cell types in the developing mouse brain, led by a team from Penn State College of Medicine and the Allen Institute for Brain Science.
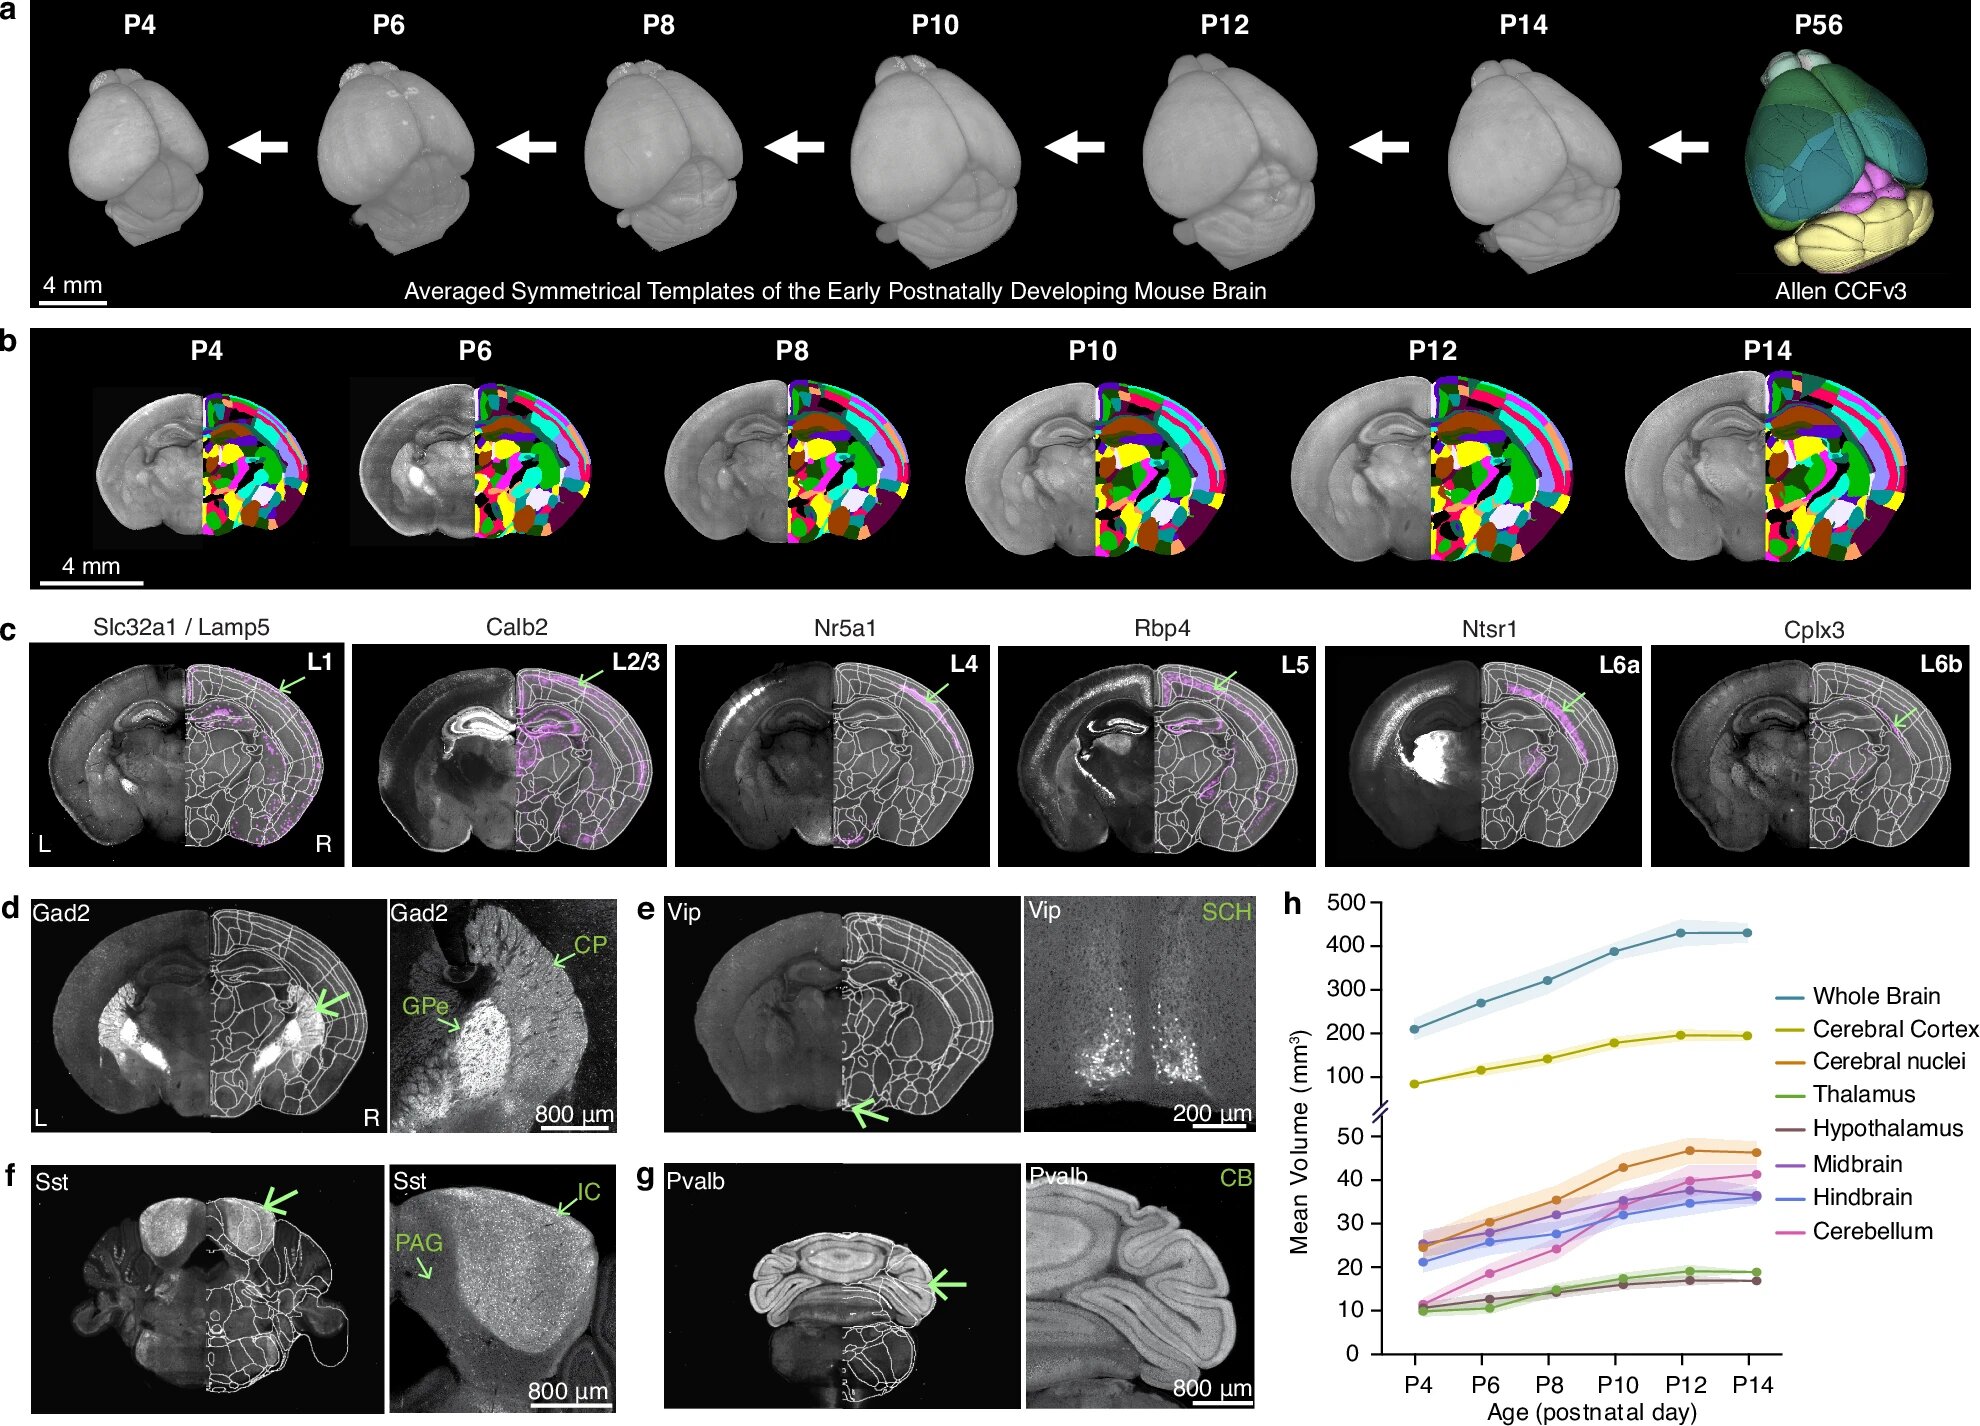
Using advanced imaging techniques, researchers constructed a series of 3D atlases that resemble time-lapse maps of the brain during its first two weeks after birth, providing unprecedented insight into a critical period of brain development. It is a powerful tool for understanding healthy brain development and neurodevelopmental disorders, the researchers explained.
The study, published in Natural communicationsalso detailed how brain regions change volume and explained the change in density of key cell types within them.
“The resolution of existing brain growth curves is poor, like a blurry photo. We created a brain growth curve at the resolution of individual cells. It’s like a high-definition photo where details appear crisp and sharp,” said Yongsoo Kim, professor of neuroscience and experimental therapeutics at Penn State College of Medicine and senior author of the paper.
The mouse brain is a mammalian model of the human brain, with similar brain chemistry and neural circuitry conserved between the two. This early postnatal phase in mice is roughly equivalent to the crucial developmental period between late pregnancy and early childhood in humans, the researchers explained. Not only does the brain mature rapidly during this window, but it is also when it begins to respond and adapt to external stimuli like sight and sound, determining where the brain grows in volume and how the brain is wired.
“This is also when many neurodevelopmental disorders, such as autism spectrum disorders, begin to manifest. These disorders can arise from both genetic and environmental risk factors, but if a problem appears early in the postnatal phase, it can spread as brain development continues,” Kim said. “The areas where expansion is the fastest are probably the most vulnerable.”
The researchers captured images of the mouse’s entire brain every other day, from the fourth to the second postnatal day, to create the high-resolution 3D growth curve. They used two-photon serial tomography, an advanced imaging technique that scans the entire brain in microscopic detail. This technique allows researchers to visualize individual cells at their precise location in the brain.
Growth is not uniform throughout the brain, researchers say. They found that the cerebellum increased in volume the most in the early postnatal period. This is the part of the brain located at the back of the head that refines movements, coordinates balance and participates in certain cognitive functions.
A team of researchers from Penn State College of Medicine and the Allen Institute for Brain Science has produced a new detailed atlas of brain growth in mice that offers insight into brain development. Credit: Kim Lab / Penn State
The researchers also studied two specific cell types that play key roles in forming the circuits that transmit and process information in the brain. They tracked changes in the density of these cell types in different regions of the brain to better understand the normal trajectory of brain development.
GABAergic neurons are inhibitory nerve cells that act as brakes in the brain and play a key role in communication in the brain. Kim explained that neurodevelopmental disorders are often associated with faulty braking systems. That’s why the team wanted to see how GABA cell types populate in the brain.
They observed that the density of GABAergic neurons decreased significantly in the cortex, the outermost region of the brain, stabilizing around postnatal day 12. In contrast, the density of these neurons increased markedly in the striatum, a deep brain structure involved in movement and reward. The results suggest that the development and population of these cells are dynamic and continue after birth.
The second type of cell they looked at was microglia, the brain’s immune cells. Kim described these cells as being similar to those of gardeners. Their main role during development is to prune unnecessary cells and connections, shaping and refining the brain’s wiring.
Microglia also showed a striking change. Until postnatal day 8, these cells are heavily populated in the brain’s white matter, a tissue made up of extensive networks of nerve fibers that facilitate communication between different parts of the brain. Around postnatal day 10, the population of microglia in the white matter decreases significantly and begins to grow into the gray matter of the brain, which is composed primarily of nerve cells.
Microglia also appear to more densely populate the areas that process sensory information as the mice’s eyes and ears begin to open. Although Kim said he does not yet know the significance of this change, it suggests that microglia may engage in brain maturation in response to external stimuli experienced after birth, such as sight and hearing.
The team also created an interactive, publicly accessible version of the atlases and growth charts to facilitate data sharing and collaboration.
“The real significance of this paper is that we provide a spatial framework for others to begin to perform higher-level integrative analyses, combining molecular, cellular and spatial data to provide a more complete picture of the brain and development,” Kim said.
More information:
Josephine K. Liwang et al, epDevAtlas: mapping of GABAergic cells and microglia in the early postnatal mouse brain, Natural communications (2025). DOI: 10.1038/s41467-025-64549-x
Provided by Pennsylvania State University
Quote: A detailed atlas of brain growth in mice offers insight into brain development (October 29, 2025) retrieved October 29, 2025 from
This document is subject to copyright. Except for fair use for private study or research purposes, no part may be reproduced without written permission. The content is provided for informational purposes only.
