

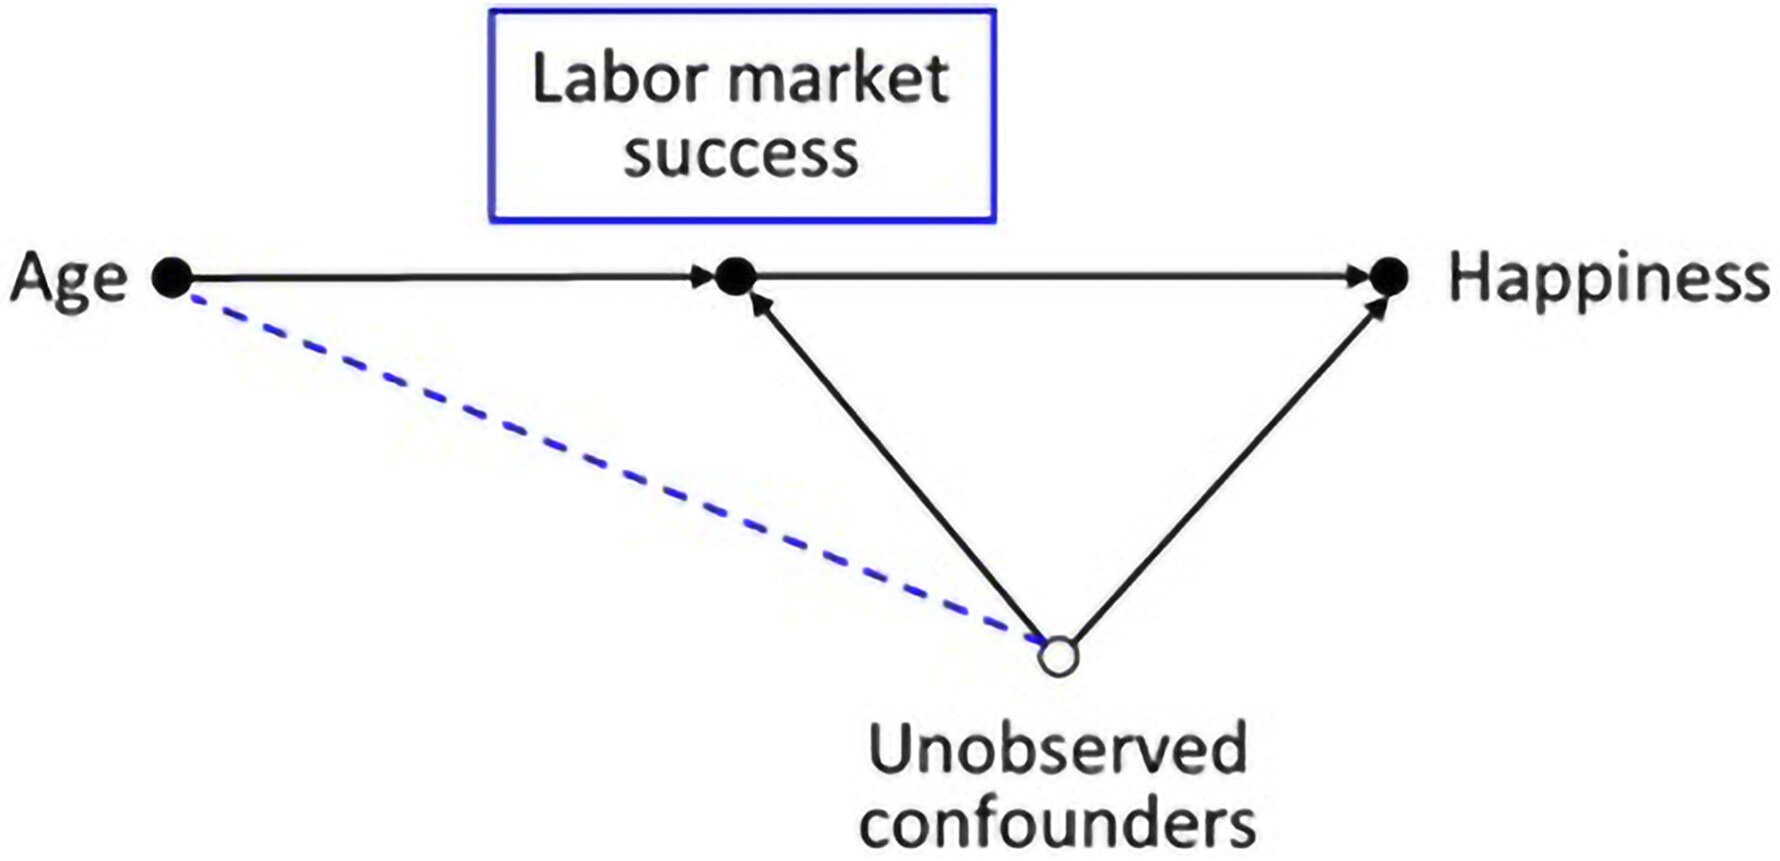
A cause and effect diagram illustrating overcontrol bias. Arrows order variables over time and show possible direct causal effects. Notes: The dashed line indicates an association that arises due to conditioning on a collider. Black dots represent observed variables while open circles indicate unobserved variables. One box represents conditioning (e.g., controlling for this variable by including it in a regression framework). Credit: European Sociological Review (2025). DOI: 10.1093/esr/jcaf038
Many survey-based studies have been conducted to try to understand how happiness changes over the course of a person’s life. Although there have been a few different findings, the most common has been the U-shaped curve. This pattern indicates that on average, people are happier in early adulthood, experience a decline during midlife (the so-called “mid-life crisis”), and then happiness increases again in old age. Yet other similar studies have reported inconsistent patterns: consistent happiness throughout life, consistent increases, consistent decreases, or even inverted U shapes.
Now, Fabian Kratz and Josef Brüderl of the Ludwig Maximilian University of Munich in Germany argue that the widely reported U-shape is largely an artifact of methodological biases, instead of a robust empirical model. Their study, recently published in European Sociological Reviewdescribes a different pattern, in which happiness declines slowly in adulthood, increases slightly in the early 60s (or “golden age”), and then declines sharply in old age.
Initially, the team sought to find an explanation for the variance between studies on age-related patterns of happiness and to determine a set of “best practices” for working with these types of studies. They used survey data from the German Long-Term Socio-Economic Panel (SOEP), taken from 1984 to 2017.
They state: “The social sciences have faced a challenge regarding the replication of research findings, raising concerns about the credibility of the findings. An illustrative case concerns research on age-related changes in subjective well-being (SWB). »
To try to remedy this problem, they decided to take a different route than their predecessors. “This study aims to demonstrate how insights from the modern literature on causal inference can help explain conflicting findings in this area of research. We use this knowledge to develop a theoretically informed and empirically validated research design, which we refer to as ‘best practice design’.”
Predicted age-happiness trajectories (including 95% confidence interval (CI)) resulting from different model specifications. Credit: European Sociological Review (2025). DOI: 10.1093/esr/jcaf038
Their job is to identify a set of common biases, including things like social desirability, in which participants report higher levels of happiness due to societal expectations. Survivorship bias is another common problem in these studies. As people age, those who are unhappy tend to have more health problems or may commit suicide, leaving healthier, happier people to continue filling out surveys, creating an upward trend in happiness at the end of life.
The team also wanted to avoid excessive control, by not controlling mediators such as health or employment. They say: “Overcontrol occurs when analysts control mediating variables, that is, variables caused by age that also affect bodily well-being. A growing body of literature on causal inference clearly demonstrates that controlling for mediating mechanisms biases estimates of total causal effects. The rationale is clear: the inclusion of such variables distorts the causal effect by explaining part of its mechanism.
To prove that these biases lead to the results of previous studies, the team also replicated older results using different combinations of biases and what they believe to be misspecifications of the data. They say the U shape is a common result of these designs.
Finally, their improved best practice view results in a sharp decline in happiness after the late 60s. They also find no evidence of the midlife crisis.
“Overall, our results do not support the notion of a U-shaped curve, at least not in the sense in which it is often conceived. There is no basis for concluding that older people become happier again. Even the slight increase during the golden years can hardly be interpreted as evidence of a U-shaped curve, since SWB remains well below happiness levels in the 20s, and the sharp decline immediately follows. Furthermore, “We would say that the decline in happiness around age 58 is difficult to interpret as a sign of a midlife crisis, since the decline in happiness is gradual throughout adulthood,” the authors write.
Yet there is no definitive, objective way to measure happiness. Subjective reports may be unreliable, and even if they are not, happiness over a lifetime may also vary by culture and location. The study authors highlight these limitations because their data is only based on German surveys. They also note that compositional variables or contextual factors may not be fully accounted for.
Written for you by our author Krystal Kasal, edited by Gaby Clark, and fact-checked and edited by Robert Egan, this article is the result of painstaking human work. We rely on readers like you to keep independent science journalism alive. If this reporting interests you, consider making a donation (especially monthly). You will get a without advertising account as a thank you.
More information:
Fabian Kratz et al, Evaluation of age trajectories (of subjective well-being): clarification of estimates, identification hypotheses and estimation strategies, European Sociological Review (2025). DOI: 10.1093/esr/jcaf038
© 2025 Science X Network
Quote: Removing common biases, study demystifies U-shaped happiness curve with age (October 10, 2025) retrieved October 11, 2025 from
This document is subject to copyright. Except for fair use for private study or research purposes, no part may be reproduced without written permission. The content is provided for informational purposes only.
